by Natalie Osborne | Apr 6, 2023
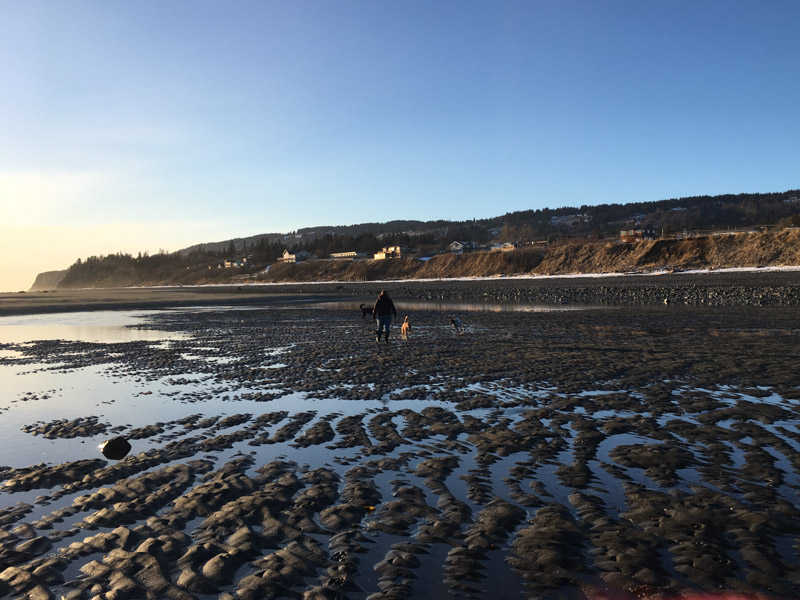
In this 7-10 day investigation, students develop an understanding of waves and tides and their motion through discussion, demonstration, and hands-on investigation. They demonstrate wave motion in containers, and create marigrams to show local tide data and to compare tide patterns from different parts of the world. They use their knowledge to consider whether waves or tides could account for the movement of the bath toys to their final locations.
by Natalie Osborne | Apr 6, 2023
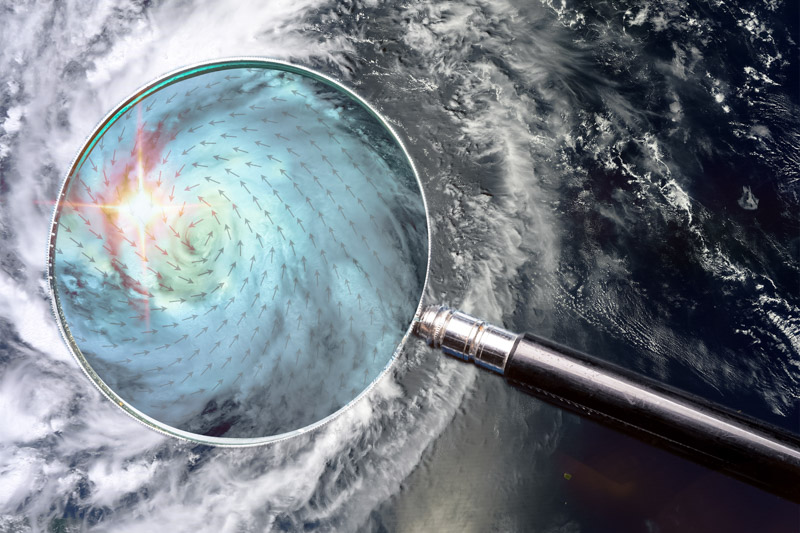
In this 5-day investigation, students develop an understanding that the large ocean circulations affecting Alaska mimic major weather patterns. They begin by creating and observing wave and riffle patterns and motions of objects in a tub. They plot possible current patterns on their map and organize meteorological data to determine how well wind patterns match their predictions.
by Natalie Osborne | Apr 5, 2023
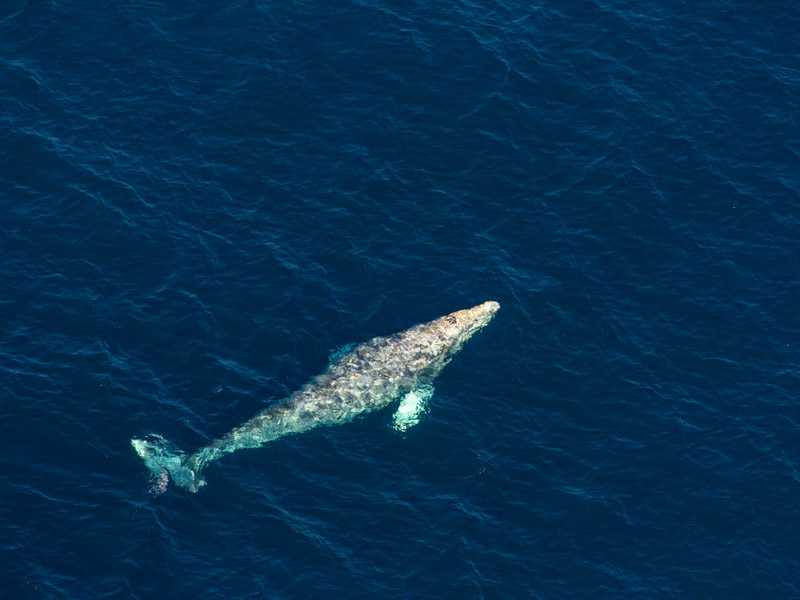
This 3-day investigation begins with students listening to a variety of underwater sounds, and deciding if the sound was made by an animal or something else. They learn about sound and how sound works in water, and about a researcher in the Bering Sea who is using sound to study the North Pacific right whale. Students learn about hydrophones and participate in an activity that simulates the use of hydrophones. Finally, they learn about spectrograms and try to identify animals by looking at the spectrograms and listening to the associated sounds.
by Natalie Osborne | Apr 5, 2023
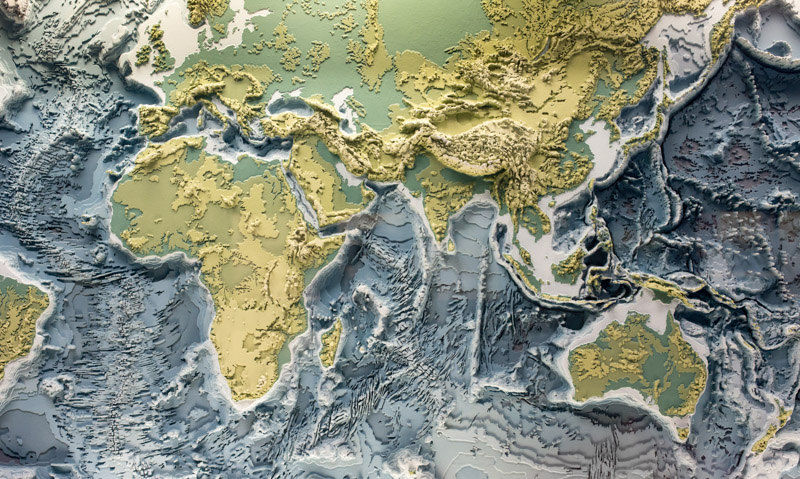
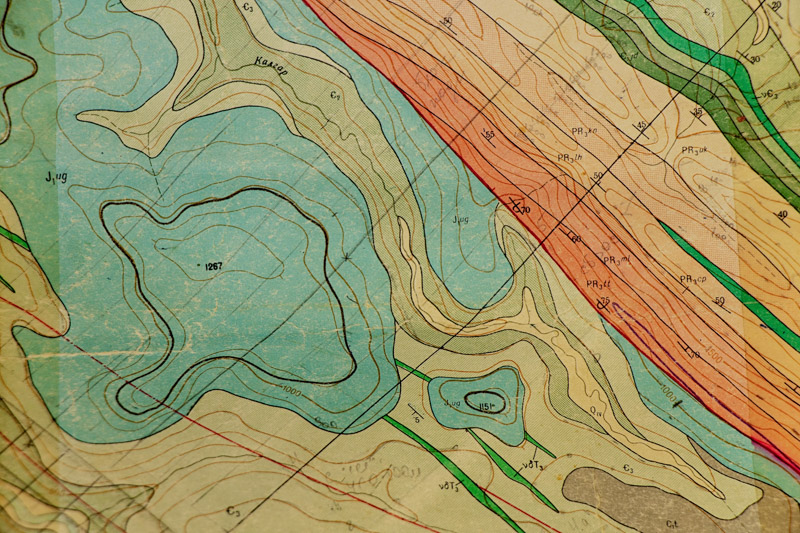
This activity will help students understand the lines and colors found on a bathymetric map or chart. It introduces them to contour maps–both bathymetric and topographic–and it introduces them to the geologic features that many explorers study. Bathymetric mapping is a major part of many of the Ocean Explorer expeditions since our understanding of the ocean floor starts with knowing what it looks like.
by Natalie Osborne | Apr 5, 2023
This activity leads students through a process of creating a model of the ocean floor, taking depth “soundings,” entering data into an Excel spreadsheet, and then creating a 3-D map of their ocean floor in Excel.
