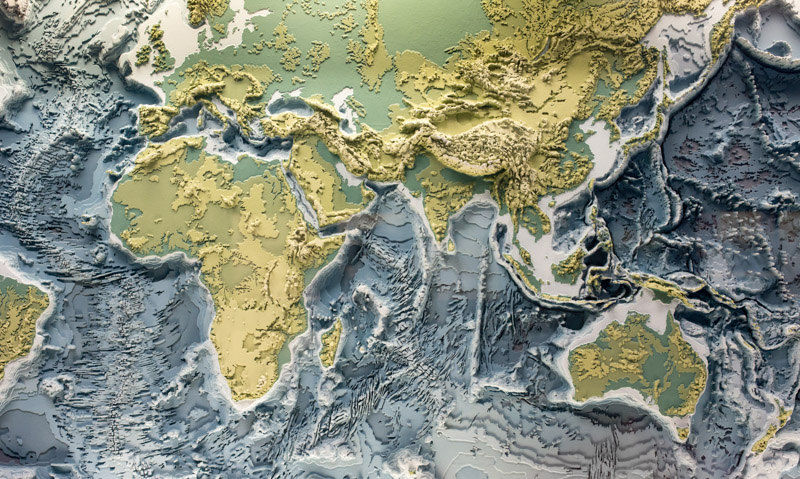
Bathymetric Mapping
Overview
This activity is adapted from “A Watered Down Topographic Map,” a NOAA Ocean Explorer Activity from http://www.oceanexplorer.noaa.gov.
This activity will help students understand the lines and colors found on a bathymetric map or chart. It introduces them to contour maps–both bathymetric and topographic–and it introduces them to the geologic features that many explorers study. Bathymetric mapping is a major part of many of the Ocean Explorer expeditions since our understanding of the ocean floor starts with knowing what it looks like.
Focus Questions
- Why is it important to map the sea floor?
- What are some ways that are used to map the sea floor?
- How are sea floor features like seamounts formed?
Enduring Understandings
- The ocean is largely unexplored.
- Humans must use ingenious ways to study the ocean.
- Exploration leads to discovery.
- Science and technology can be used to detect and solve problems.
Exploration
70-80 Minutes
- Distribute the plastic food storage containers and sticks of clay to each group. Each group should build a clay model of the ocean floor with one prominent ocean feature. The model may not extend above the top of the container. For ease of construction, they may assemble them on the desk and then install them in the container.
Show or distribute a copy of the Ocean Features diagram. - Challenge the students to create a two-dimensional map of their three-dimensional underwater feature that would visually interpret it for other groups of students. Help them think this through as a group. Draw a large circular shape on the board. Ask the students what they think the drawing represents. Guide the answers, if necessary, toward maps of landforms, such as a pond, an island, a racetrack circuit, and so on. Could it be the base of an underwater mountain? Draw a side view of an undulating mountain directly below and matching the horizontal margins of the circle. Tell the students the two drawings represent the same thing, but from a different perspective. Ask the students again what they think the circular shape and the new side view of the circular shape represents. A mountain should be one of the obvious answers. How can we combine the two dimensions of the circle with the third dimension–height–in the second drawing on a flat map?
- Distribute the Bathymetric Mapping Instructions and ask students to carefully follow the instructions. When the equipment is ready, have the students check with you to make sure they set up correctly. Depending on your students’ abilities, you may have all setups complete and proceed as a class through drawing of the contour line. Some classes will take off and do this very well on their own. After they complete the first contour line, have the class add water to the first centimeter mark on the ruler closest to the bottom of the container, reminding them to take care when pouring the water into the funnel and pour SLOWLY, so they can be very accurate in their measurement. Once they draw the second contour line they may work at their own speed, completing Part 1 of this activity.
- When the “maps” are completed, re-introduce the terms topographic and bathymetric maps and discuss contour lines to make sure the concept is clear. On these maps, areas with the same depth are connected by lines, so that mountains are shown as a series of concentric, irregular closed curves. Curves that are close together indicate steep topography, while curves that are farther apart show more gentle slopes.
- Show the black and white bathymetric map of the Patton Seamount. Then show the color version of the same map. Note the color key at the bottom of the map. Ask students if the color helps them read the map easier.
- Now ask students to complete Part 2 of the instructions. They will have a color map showing the feature(s) that they created.
Explanation
20 Minutes
Display the models in a location where students can easily see them. Display one of the student maps on the overhead projector and ask students to choose the model that it represents. Continue with the remainder of the maps and discuss as necessary.
Elaboration
20-30 Minutes
Show a bathymetric map of a new area and ask students to describe what the contour lines reveal.
If possible, show students a topographic map of a local area, and ask them to point out local features.
Teacher Needs
Teacher Prep
Read through all of the investigation, background materials, and supplementary materials, and watch videos. Gather supplies, try out the activities, and create examples of the bathymetric map and/or sounding box if desired. Prepare to show videos and illustrations. Print and copy the student handouts.
Materials List
Per team of 3-4 students:
- Plastic food storage container or tub, about 4-6 inches deep and 5-7 inches long and wide. Containers need not be transparent
- Modeling clay. Amount required will depend on the size of containers used.
- Bottle, beaker, or measuring cup with sufficient water to fill the plastic container after the clay has been placed in it.
- Plastic or paper funnel
- Centimeter ruler
- Strong clear plastic such as a blank overhead transparency, to cover the container. This will be used to draw on and must be transparent. Strong plastic wrap may also work.
- Waterproof black felt tip marker (fine tip, if possible)
- Waterproof felt tip markers: dark blue, light blue, green, yellow, orange
- Masking tape
- Scissors
Student Needs
Prior Knowledge
Basic concepts of mountain formation and of plate tectonics. Experience with grid systems.
Vocabulary
Hydrographic survey, sonar, multi beam sonar, sidescan sonar, bathemetry, topographic maps, contour line, biological productivity, Global Positioning System, concentric topography,tectonic, seamount, magma, enigmatic, endemic
Standards
Science GLEs Addressed
-
6th Grade: SA1.1, SA1.2, SD2.3, SE1.1, SE2.1, SE2.2, SE3.1
-
7th Grade: SA1.1, SA1.2, SD2.2, SE2.2, SE3.1
-
8th Grade: SA1.1, SA1.2, SD2.1, SE2.2, SE3.1
Other GLEs Addressed
[bws_pdfprint display=’pdf’]

